Optimization and Analytics for the Power Sector: from Generation to Distribution
The power sector combines physical and financial decisions that influence each other all the time: how much to generate and when to do maintenance, how much to contract and at what risk, how to interpret grid events, and where to invest in distribution. Regulatory, hydraulic, and climate constraints change what is possible, and the margin for deciding poorly is small.
Enacom works across the whole value chain, from generation, trading, transmission, and distribution, with mathematical optimization, machine learning, and Digital Twins. We start from the decision and the information it needs, connect industry knowledge to analysis methods, and structure R&D and innovation projects with the client’s technical teams.
The portfolio includes more than 25 products created and licensed to the market and more than 50 projects for major energy companies.
30 mindiscretization in next-day hydro plant scheduling
100+configurable constraint types, hard or soft
~3%more electricity consumption for each 1 °C increase, in the Climate Diagnostic
25+products created and licensed to the market
Why it works: the decision weighs the physical and the financial gain together
In energy, what improves generation can worsen commercial risk, and the reverse also holds. The solution compares alternatives with the operational and economic impact side by side, within the hydraulic, environmental, and regulatory rules that apply to the operation.
Generation and trading stop deciding separately
Scheduling the plant without looking at the contract portfolio, or contracting without looking at availability, leaves money on the table. The solution puts return and risk side by side, so the decision is made with both in view.
More energy from the same water
Daily hydro plant scheduling raised output by about 2% and cut water use, with environmental constraints met. It is a gain from a structure that already existed, with no new plant.
Fewer surprises in demand
In the Climate Diagnostic, which won the ECO Award 2025 with CEMIG, forecast error fell about 50%. Better forecasts mean more certain energy purchases and grid investment.
Decision validated before scaling
Alternatives are tested on known periods and in a pilot with technical teams, so the impact is clear before the commitment.
Financial return. The value in reais depends on each operation’s volume and margin. We calculate the return and payback period with your company’s data, before scaling the project.
Hydro Generation: Scheduling, Unit Commitment, and Maintenance (Hydro Scheduling and MRGF)
In generation, the decision is how to turn water, environmental constraints, and unit availability into a schedule that generates more energy from the same resource.
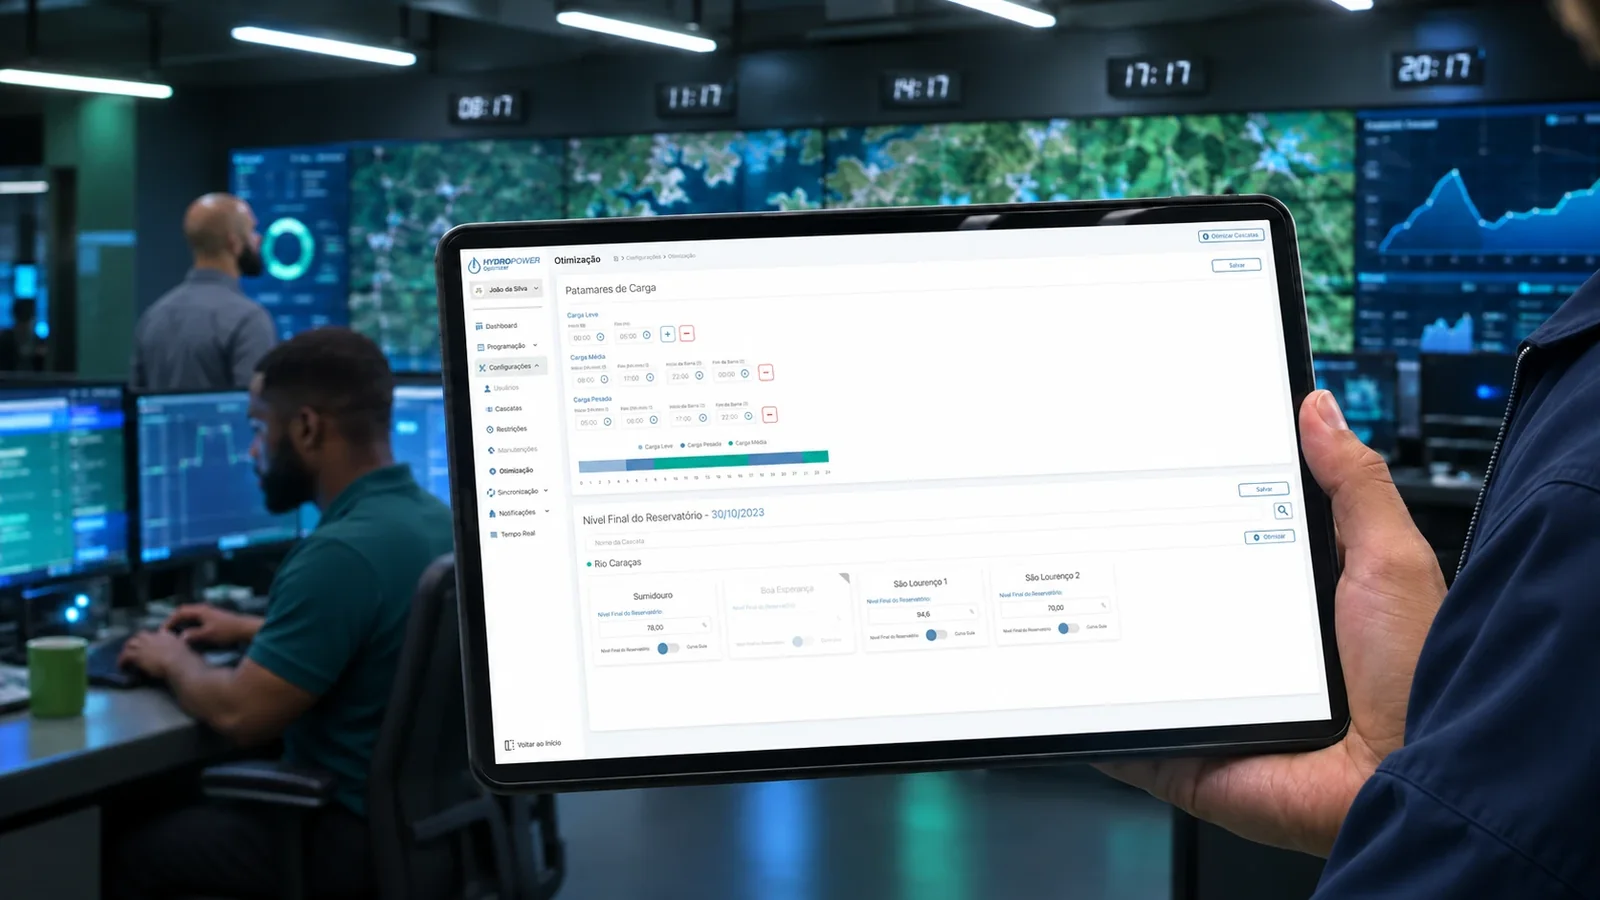
Daily Hydro Plant Scheduling and Unit Commitment (Hydropower Optimizer)
Digital twins of 16 large plants plan the next day with 30-minute discretization, detailed environmental constraints, and unit commitment modeling. The solution runs in the cloud, integrated in real time with the PI System and ONS communication, and supports more than 100 constraint types, each configurable as hard or soft. Results include about 2% more production, lower water use, and compliance with environmental constraints.
Water Travel Time and Hydraulic Losses in Cascades (Water Travel Time)
Machine learning models replace constant travel time with a dynamic time between reservoirs, including in complex cascades. This makes flood-control analysis and reservoir balancing more robust.
Maintenance Scheduling and MRGF Exposure (Physical Guarantee Reduction Mechanism)
Optimization allocates predictive maintenance across a hydro fleet by projecting each asset’s availability index, to reduce exposure to MRGF penalties.
Wind Generation Scenarios and Energy Storage (BESS)
Wind scenarios (2,000 series generated with ARIMAX) value the risk and return of trading and its relation to hydro inflow. For batteries, we simulate the viability of storage investment alongside a wind asset, under trading rules and hourly price.
Energy Trading and Portfolio Management (Risk x Return, CVaR, and Forward Price)
In trading, every contract changes the portfolio’s expected return and risk. The decision is which buy and sell composition meets the revenue goal without exceeding risk appetite.
Risk x Return Trade-off and Contract Portfolio Optimization (CVaR)
A multiobjective optimization compares expected revenue with risk metrics such as CVaR, year by year, in scenario dashboards.
Forward Price Forecasting and the Forward Curve
Machine learning models project the forward price curve across several maturities, combining different data sources.
Competitor Strategy Mapping and Seasonalization (Game Theory)
A game theory model bounds the impact of other traders’ strategies on the client’s portfolio in free-energy allocation. The model was back-tested between 2013 and 2020.
Decision under Uncertainty in Contracting (Hurwicz, Savage, Laplace, and Wald Criteria)
When postponing or removing contracts or adding new generation assets, impact analysis ranks the alternatives with multicriteria decision theory.
Transmission: Auction Analysis and Intelligent Event Analysis (IEA, ONS, and ANEEL)
In transmission, decisions appear before, in the line auction, and afterwards, in the analysis of events that affect operations and regulatory compliance.
Transmission Auctions: Route Optimization and Georeferenced Risk
The system analyzes tender documents, optimizes the route, and assesses cost and risk with georeferenced data on terrain, rivers, and protected reserves. Dashboards prioritize lots by engineering, regulatory, environmental, geological, tax, landowner, O&M, supply, and logistics risk.
Intelligent Event Analysis (IEA) and Regulatory Reporting
The tool analyzes, in real time and retrospectively, events in transmission and generation equipment: outages, interventions, and protection trips. With direct ONS integration, it raises analysis productivity and reduces errors in the regulatory reports sent to ANEEL.
Power Distribution: Asset Management, Demand Forecasting, and Climate Resilience (AMI and DG)
In distribution, decisions range from where to expand the grid to how to keep assets running and how to deal with weather and distributed generation. The basis is operating data turned into strategy.
Climate Diagnostic of Demand and Consumption Forecasting
Machine learning models measure how temperature and precipitation affect the energy injected into the grid and distributed micro and mini generation (DG). In the project’s presentation, each 1 °C increase corresponds to about 3% more electricity consumption, and forecast error fell about 50%. The work, done with CEMIG, won the ECO Award 2025, from Amcham Brazil.
Spatial Demand Forecasting and Grid CAPEX Prioritization (2 km × 2 km Grid)
The system forecasts the demand of an entire state in seconds, on a 2 km by 2 km grid, linking grid topology (substations and feeders) to spatial cells. The expansion plan then prioritizes cells where demand exceeds available capacity.
Transformer Diagnostics and Remaining Useful Life (Predictive Maintenance)
Three models use temperature and vibration sensors: they classify asset condition (Normal, Attention, Critical, and Failure), detect time-series anomalies, and estimate remaining useful life. The result improves outage duration indicators.
Collection Actions, Delinquency, and Bad-Debt Provision
Optimization distributes annual investment across collection and disconnection actions by region and links the investment to the reduction of the bad-debt provision through a Pareto frontier. A default prediction model, trained on more than 20,000 candidate economic series, feeds that decision.
Network Reconfiguration and Smart AMI
Network reconfiguration seeks lower electrical losses and less overload, with a proprietary power-flow algorithm and switching recommendations per feeder. Smart AMI supports operation, planning, and expansion decisions with smart meter data.
News. Enacom and CEMIG won the ECO Award 2025 with the Climate Diagnostic. Read the news
Comparison: traditional approach vs. Enacom optimization and AI for the power sector
How each approach handles the criteria that define the quality of decisions in generation, trading, transmission, and distribution.
Operating criterion
Spreadsheets and isolated models
Generic market software
Enacom optimization and AI (Gemminus Platform)
Hydraulic, environmental, and regulatory constraints
Applied by hand, spreadsheet by spreadsheet, with review afterwards
Fixed set of rules; hard to represent the real asset
More than 100 configurable constraint types, hard or soft
Next-day scheduling
Built manually, with little time to compare alternatives
Standard discretization and low fit to the plant
30-minute steps, with unit commitment and detailed constraints
Return and risk
Analyzed separately, by different areas
Focus on expected return; risk handled apart
Multiobjective return × risk optimization (CVaR), year by year
Demand and price forecasting
Historical averages and manual adjustments
Generic statistical models, without the business’s weather
Machine learning with weather and the forward curve; in the Climate Diagnostic, forecast error about 50% lower
Technology integration
Isolated from operating systems
Often requires new databases and a long rollout
Works alongside the PI System and SAP and with regulatory communication with the ONS, in the cloud
Return focus
Keeping the routine
IT standardization
More energy from the same water and contracting decisions with risk in view
Energy Applications on the Gemminus Platform: Cloud Data and Integration with Sector Systems
Energy solutions run in the cloud and integrate with the data sources the client already uses, such as the PI System, SAP, and maintenance management systems, and with regulatory communication with the ONS. The path from model to routine is part of the project, not a later step.
Each application is built on the Gemminus platform, with governed data, comparable scenarios, and explicit assumptions, so technical, commercial, and regulatory areas discuss from the same reference.
Decisions with impact in view: we show the operational and economic effect of each alternative before deciding.
Applicable technical conditions: alternatives are compared under the hydraulic, environmental, and regulatory constraints that apply to the operation.
A path to routine use: applications are born with integration, indicators, and follow-up defined with the team.
How to Start: Decision Diagnosis, Pilot with Technical Teams, and Routine Use
In energy, the project starts from the decision and the information it needs, with technical, commercial, and regulatory areas involved from the start.
1. Diagnosis of the decision, constraints, and data
We define the decision, the applicable hydraulic, environmental, contractual, and regulatory constraints, and the data sources, such as the PI System, SAP, and maintenance systems.
2. Modeling and validation with history (Backtesting)
We test the model on known periods and compare the alternatives with what was decided, putting the operational and economic impact in view.
3. Pilot and structuring of R&D and innovation
When the topic is new, we structure the R&D and innovation project with technical teams and validate it in a pilot before widening.
4. Integration and routine use
The application starts operating integrated with the data sources and regulatory communication, with indicators and follow-up defined with the team.
Frequently asked questions about optimization and AI in the power sector
Which power sector decisions does Enacom support?
Generation and maintenance scheduling, trading and contract portfolio, transmission auction and event analysis, and distribution, with demand forecasting, asset management, and climate resilience.
Do the solutions work with the systems we already use?
Yes. Applications integrate with sources such as the PI System, SAP, and the client’s data platforms, and with regulatory communication with the ONS.
How does Enacom handle uncertainty and risk?
With scenarios and risk metrics, such as CVaR, and with multicriteria decision criteria. Assumptions stay explicit, so the team sees the impact before committing.
Do you work on R&D projects?
Yes. We structure R&D and innovation projects with technical teams, connecting industry knowledge and analysis methods.
What did the Climate Diagnostic achieve?
In the project’s presentation, each 1 °C increase corresponds to about 3% more electricity consumption in Minas Gerais, and forecast error fell about 50%. The project, with CEMIG, won the ECO Award 2025.
From research to operations: cases and scientific papers
Each front pairs the case where the optimization ran in operation with the papers in which Enacom's team publishes the methods behind that front at technical conferences and in scientific journals. Practical proof and scientific proof, side by side.
Generation and maintenance planning
Case in operation
Hydropower Optimizer at CEMIGCEMIG: up to 46.6 hm³ less water per month in the Três Marias plant schedule, in a study