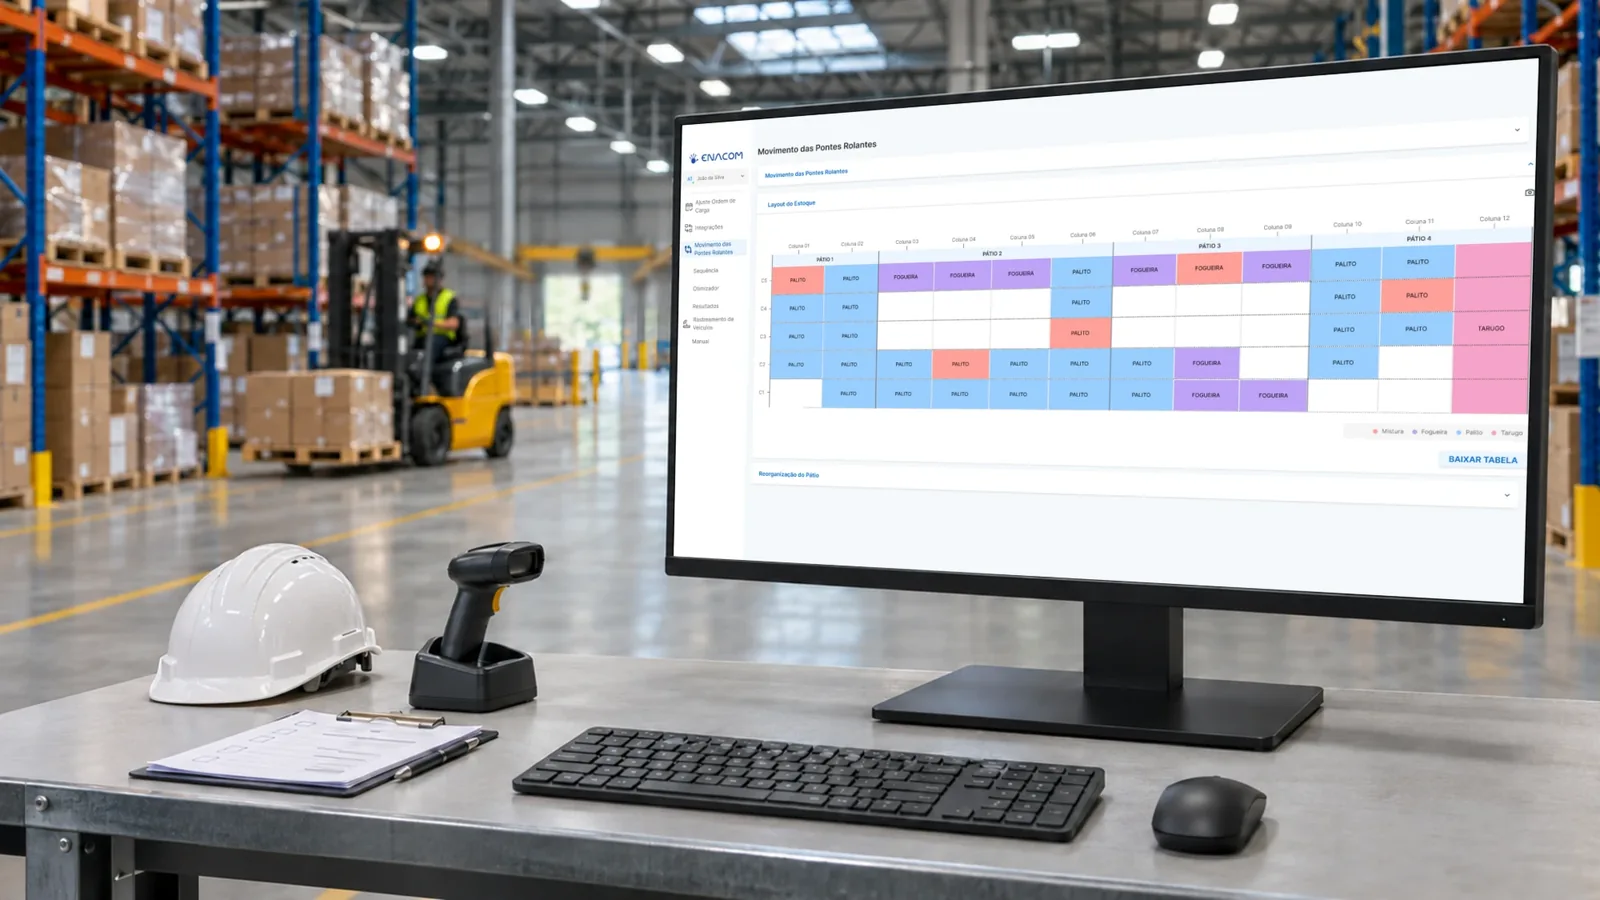
Promise only what the operation delivers
The capacity limit becomes visible before the commitment, which reduces delays, rework, and friction with the customer.
 Talk to an expert
Compare plans against materials, capacity, and priorities. Understand how each alternative affects your delivery commitments.
Discuss your planning challengeIn supply chain, the hard decision is rarely in a single area. Sales wants to promise a date, production has a capacity that depends on calendars and changeovers, materials arrive with different priorities, and inventory is the buffer nobody wants to see grow. When each area works with its own version of the plan, the commitment made to the customer goes beyond what the operation can deliver.
Enacom puts capacity, materials, and inventory in the same analysis, with explicit assumptions. The Planning Digital Twin organizes four modules, Demand, Inventory, Capacity, and Sequencing, and covers horizons from the real-time control tower to the multi-year business plan. The team compares choices on the same reference, not on diverging spreadsheets.
We start by assessing what your systems already cover and complement where an additional analysis helps, connecting the tactical plan to scheduling.
In supply chain, sales promises a date, production has limited capacity, and inventory cushions everything. When each area works with its own version of the plan, the commitment goes beyond what the operation delivers. The solution puts capacity, materials, and inventory in the same analysis.
The capacity limit becomes visible before the commitment, which reduces delays, rework, and friction with the customer.
Inventory and capacity are decided together, and stock covers what is needed, not what is left over from a single rule. In a logistics network case, the analysis identified 304 improvement opportunities, 44% of them solved with software.
With explicit assumptions and the same reference, the conversation between operations and the business moves from opinion to impact on lead time, margin, and cost.
We start with one specific decision, with a pilot, and only then connect the tactical plan to scheduling. The risk is small and the result is verified early.
Financial return. The value in reais depends on each operation’s volume and margin. We calculate the return and payback period with your company’s data, before scaling the project.
Nominal capacity misleads. The capacity that counts is what remains after calendars, setup times, maintenance, and resource availability. The decision is what fits, when, and at what cost.
Capacity is calculated with process conditions: shifts, scheduled downtime, setup times, and equipment availability, instead of a fixed rate per period.
The analysis shows where the bottleneck really is and how much, in lost productivity, a change of sequence that better serves one order costs.
Scheduled downtime and the production plan sit in the same view, so maintenance is allocated without unplanned loss and sales promises within what capacity allows.
Maintenance windows enter the plan as a decision, not as an interruption: the model allocates date, duration, and type against commercial constraints, so production loss is as small as possible and visible before the stoppage.
When material is scarce, someone decides who gets it first. The right decision depends on deadline, margin, available stock, and the capacity to turn material into product.
Materials and scheduling stop being sequential steps. Allocation considers transformation capacity, and scheduling considers real material availability.
The team compares prioritization criteria on the same reference and sees the effect of each on delays, margin, and capacity use.
The commitment to the customer comes from a plan that already considers capacity, materials, and inventory, which narrows the gap between what is promised and what is delivered.
Inventory is sized from the desired service level and the variability of demand and lead time, with coverage calculated per point in the network, not by a single rule applied to every item.
A change in volume or order mix changes the capacity required, inventory, and lead time. The decision is to understand the limit before taking on the commitment.
Volume and order-mix scenarios are generated and compared, with the effect on capacity, inventory, and service level in view.
The analysis shows the point where the operation stops keeping up with demand, and the conversation with sales stops being a contest of opinions.
Assumptions are documented and comparable, so operations and business areas discuss the same reference. The result is more alignment between areas.
When demand exceeds capacity, the team compares allocation rules across customers and contracts, with the effect of each rule on delays, margin, and service level, instead of deciding case by case.
The tactical plan is only worth it if it reaches scheduling. The decision is how to connect the S&OP horizon to what the shop floor will face next week.
The Planning Twin covers the chain from PCP to S&OE, S&OP, the budget, and the business plan, so the tactical plan and scheduling run on the same model.
The inventory module treats the levels of the network together, instead of sizing each point in isolation, and supports the definition of replenishment and safety stock policies.
The Gemminus platform connects the systems in use, consolidates the data, and returns plans and alerts. Coexisting with what already exists is part of the project.
From the real-time control tower to the multi-year business plan, the same model is updated with real status, and replanning starts from the operation’s current state.
Reference. The logistics network and Distribution Centers case applies the same logic to an entire supply chain. See the supply chain case
How each approach handles the criteria that define the quality of integrated planning of demand, capacity, and inventory.
| Operating criterion | Spreadsheets and manual S&OP meetings | Generic ERP and APS | Enacom Digital Twin (Gemminus Platform) |
|---|---|---|---|
| Capacity | Fixed nominal rate per period | Finite capacity with standardized parameters | Finite capacity with calendars, setup times, downtime, and resource availability |
| Materials and priorities | Allocation and scheduling in separate steps, by different areas | Standard priority rules, hard to adjust | Allocation and scheduling in the same analysis, considering transformation capacity |
| Demand and mix scenarios | A single plan; each scenario requires rebuilding spreadsheets | Limited to preset parameters | Side-by-side comparison of volume and mix scenarios, with explicit assumptions |
| Inventory | One safety-stock rule for every item | Policies per point, with no view of the network | Multi-echelon inventory (MEIO), with network levels treated together |
| Technology integration | Data replicated by hand between areas | Often requires replacing systems | Works alongside existing ERP, MES, TMS, and WMS, via integration |
| Return focus | Keeping the routine | IT standardization | Delivery commitments within capacity and less dispute between areas |
The Planning Digital Twin is Enacom’s planning backbone and is reused across industries. It brings together demand, inventory, capacity, and sequencing and connects to the ERP, MES, APS, TMS, and WMS in use.
The path is gradual: assess what the systems already cover, complement where an additional analysis adds value, and connect the tactical plan to scheduling, with a pilot before scaling.
In supply chain, the project starts by assessing what the systems already cover and picks a decision where an additional analysis makes a difference.
We map the S&OP and PCP process, the systems in use, and the points where the plan and scheduling stop talking, without assuming anything needs to be replaced.
We build the model with calendars, setup times, resource availability, and inventory policies, with explicit assumptions reviewed by the areas.
We choose one decision, such as the delivery commitment or the allocation of scarce materials, and compare scenarios on the same reference, with the planner in control.
With the pilot stable, we link the tactical horizon to sequencing and to the transactional systems, so the plan reaches the shop floor.
It is a model that represents the operation’s capacity, materials, inventory, and demand, and lets teams simulate scenarios and compare plans before taking on commitments.
No. Enacom assesses what your systems already cover and complements where an additional analysis helps.
It puts capacity, materials, and inventory in the same analysis, with explicit assumptions, so operations and business areas talk from the same reference.
Yes. In a steel company case, the network analysis considered 500 possible locations and identified 304 improvement opportunities, of which 44% can be solved with software.
With one specific decision, such as the delivery commitment to the customer or the allocation of scarce materials, with a pilot before widening.
Real supply chain analysis and optimization projects, with the results and the conditions under which they were obtained. Client names are kept confidential.
Steelmaker identifies 304 supply chain improvement opportunities by optimizing its distribution network
View caseEach front pairs the case where the optimization ran in operation with the papers in which Enacom's team publishes the methods behind that front at technical conferences and in scientific journals. Practical proof and scientific proof, side by side.
Case in operation
Tell us what is holding your operation back. Together, we can assess the challenge and where Enacom could help.