Bottlenecks that move
The bottleneck depends on the day's mix. A static analysis points to the wrong equipment and the investment goes to the wrong place.
 Talk to an expert
Solutions · Performance Digital Twin
Your indicators show each piece of equipment. Results depend on the entire flow and the product mix running through it. With the Performance Digital Twin, you see performance by flow and by SKU, anticipate bottlenecks, and measure the risk of each plan before it turns into a delay.
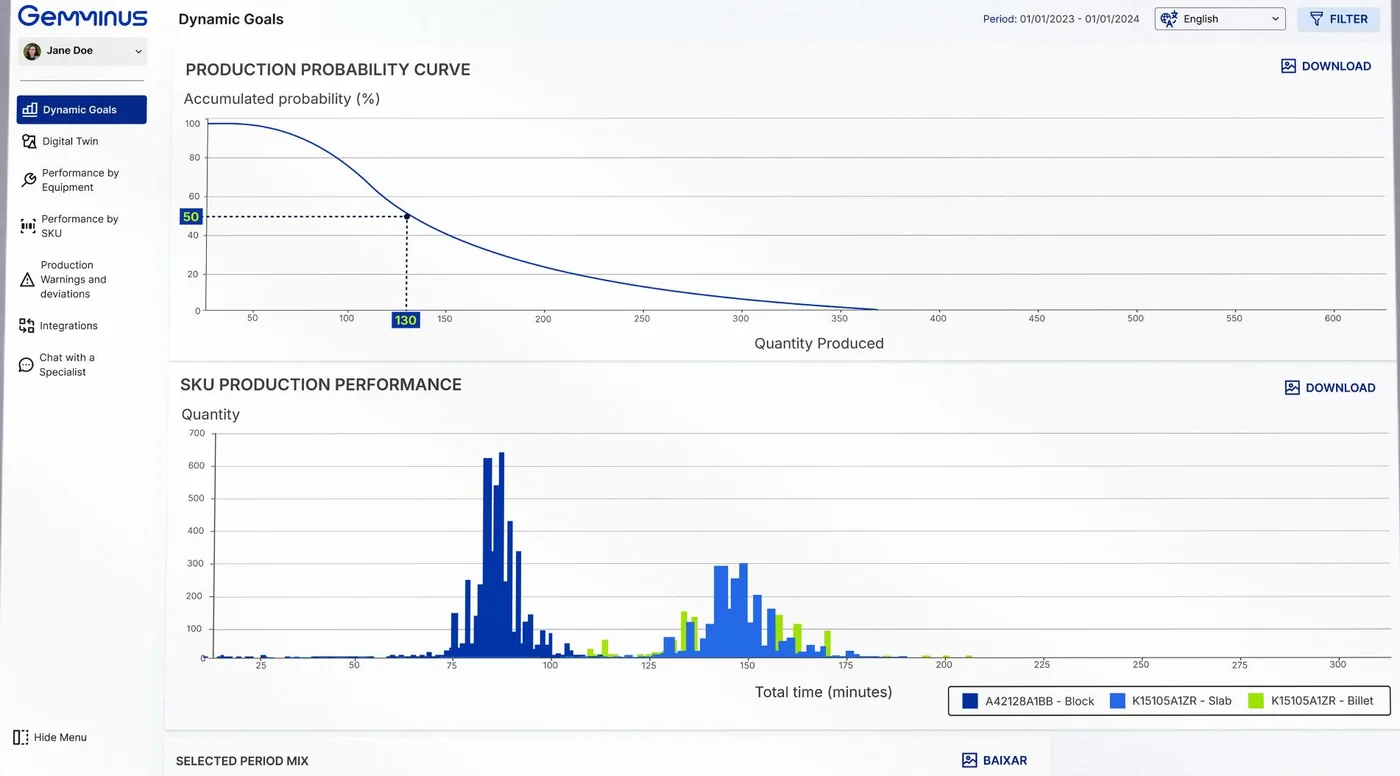
Most industries measure performance in silos: OEE per machine, availability per asset, targets based on averages. But the month's result is not the sum of isolated machines. It depends on how the product mix moves through the flow, where the bottleneck is today, and how much risk the plan carries.
The bottleneck depends on the day's mix. A static analysis points to the wrong equipment and the investment goes to the wrong place.
Average-based targets demand the same volume in a month with simple SKUs and a month with complex SKUs. The team loses the reference for what good performance is.
Sales promises a fixed lead time. Production finds out about the delay only after it has happened.
There is history in the MES and ERP, but it is unstructured. Cross-filtering to find the cause of a deviation takes days, and the decision ends up being made on intuition.
The Performance Digital Twin is a digital replica of your production flow. It measures performance by flow, by SKU, and by customer, not just by equipment, and shows where the bottleneck is, what a fair target is, and how much risk each plan carries.
Discuss your applicationThe cycle has five steps and runs continuously, in real time.
Each feature answers a question that industrial management asks every day.
Where exactly are we losing?
See the complete flow, from raw material to finished product, and compare each SKU's performance at every step. Dispersion by process shows where variability begins.
What is the bottleneck today, with this mix?
The twin recalculates the bottleneck as the mix changes and warns you in advance, for example: “the ladle furnace will be a bottleneck over the next 5 hours”.
What is the fair target for this month?
Production targets calculated from the SKU mix and the chain's real performance, with statistical risk analysis. The end of average-based targets.
What are the chances of meeting this plan?
Compare plan scenarios and see the probability of reaching each volume, based on historical deviations. Decide which level of risk to accept before making a promise to the customer.
What needs action now?
Warnings about production order delays, execution times outside the historical pattern, quality outside the indicator, and poor data quality, with automatic statistical validation.
Why was the plan not met?
Compare what was planned with what was executed, identify discrepancies, and improve the next planning cycle.
Are we improving?
Complete history across SKU, flow, and customer dimensions, for comparative analyses and trend identification over time.
Which products really generate margin?
Production cost detailed by SKU and by flow, not allocated by volume, to protect margin and manage inventory more precisely.
The difference is not having more charts. It is replacing the silo view with a customer-oriented value stream view.
| Dimension | Traditional tools | Performance Digital Twin |
|---|---|---|
| Data | Unstructured history | Structured real-time data, with big data processing |
| Indicators | Individual by asset or silo (OEE, physical availability) | Integrated by flow and production mix |
| Bottlenecks | Fixed, static | Dynamic, according to the mix and customer service |
| Targets | Based on averages, not very sensitive to the mix | Dynamic, calculated from the SKU mix |
| Cost | Aggregated, allocated by volume | By flow and by SKU |
| Alerts | Predefined limits | Smart alerts with statistical validation |
| Customer lead time | Fixed lead time, without measuring risk | Dynamic lead time, with probability of fulfillment |
| Risk analysis | Usually nonexistent | Based on historical deviations and the production plan |
| Decision | Unstructured history and intuition | Real-time analysis compared against history |
Deployment is built on Gemminus, Enacom's proprietary Digital Twin platform. That means starting from a ready base and customizing it to your plant's reality, instead of starting from scratch.
Integration with your systems and modeling of your production flow.
Our team follows day-to-day use until your team gains autonomy.
New analyses, flows, and units as the operation matures.
For industries with complex production flows, a high product mix, and delivery commitments to customers. The solution was born in steel operations and applies to any process chain with multiple routes and SKUs.
SteelMiningLogistics and Supply ChainEnergy & UtilitiesProcess industry
An integrated view of chain performance and of the risk to the month's result.
Fair targets by mix, anticipated bottlenecks, and planned vs. actual.
Root cause of deviations by flow and SKU, without weeks of cross-checking spreadsheets.
Delivery dates promised with a known probability of being met.
See the decision pages linked to this content.
Increase productivityReduce costsImprove operationsUnderstand cost and marginFlow and SKU performanceRisk and capacity
It is a digital replica of the production flow that measures performance by flow, by SKU, and by customer, not just by equipment. It combines operational data with knowledge of the physical process to identify bottlenecks, calculate targets adjusted to the mix, and estimate the risk of production plans.
OEE measures the efficiency of an isolated piece of equipment; the Performance Digital Twin measures the performance of the entire flow, considering the product mix. It does not replace OEE: it incorporates that indicator into an integrated view that shows how each asset affects the result delivered to the customer.
Dynamic bottlenecks are capacity constraints that move as the production mix changes. A machine can be a bottleneck with one set of SKUs and have slack with another. The twin recalculates the bottleneck continuously and alerts you before it affects production.
It uses the historical distribution of each step's times by SKU to estimate the probability of the plan reaching a given volume. This way, management compares scenarios and consciously chooses the level of risk it accepts before making commitments to customers.
With MES, ERP, APS, TMS, and WMS, among others. The solution works as a single point that consolidates data from different sources into a unified view of the operation.
About 4 months from first data to first result, including customization and assisted operation. The timeline depends on the flow complexity and the maturity of the available data.
The model is setup + subscription. The subscription covers licensing, support, training, version updates, and customization services.
For industries with complex flows and a high product mix, such as steel, mining, logistics, and process industries. The solution was developed from steel operations.
Not necessarily. Part of the deployment is structuring and validating the data that already exists in the MES and ERP. For companies that need a governed industrial data foundation, Enacom also offers the Gemminus Data Platform.
With the Digital Twin Tutor, managers and analysts talk to the Performance Twin using generative AI. Instead of browsing dashboards, just ask: “How do CO2 emissions change if yield goes up 2%?”. The Tutor answers based on the twin's own data and relationships, not on generic knowledge.
In a conversation with our specialists, we map your flow, your mix, and the questions that go unanswered today.
You leave with a clear view of where the Performance Digital Twin delivers results in your plant.