
Logistics planning now shows, before execution, how much the operation can move and where the bottleneck is
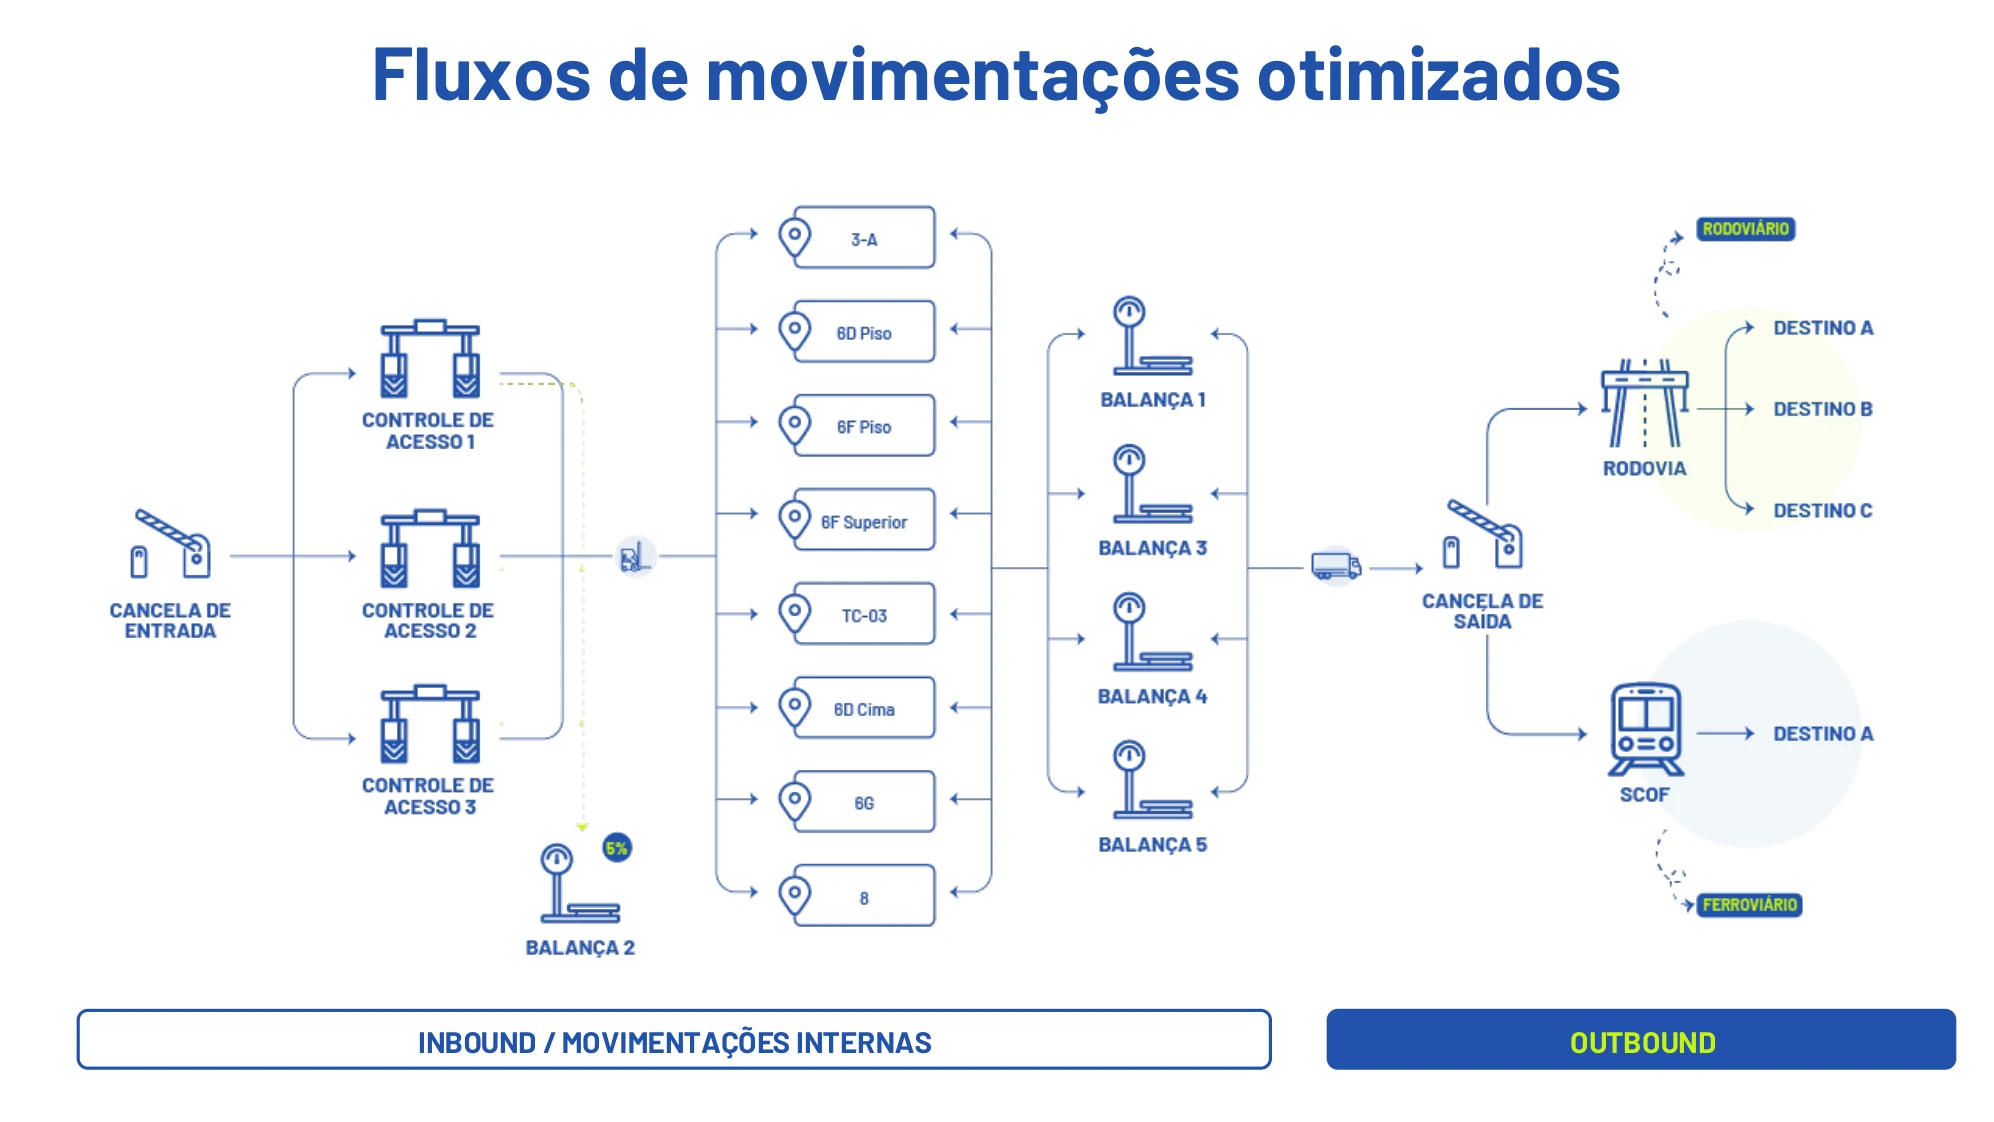
With Enacom’s Logistics Optimizer, the operation began planning receiving, internal handling, and dispatch in a single model, from the next day to the next month, comparing the desired volume of each material with what trucks, trains, and equipment can actually deliver.
Talk to an Enacom expertKey results
- D+1 to M+1
- planning horizon covered by the same model
- 3 stages
- receiving, internal handling, and dispatch analyzed together
- 2 modes
- road and rail in the same calculation
- By material
- bottlenecks detected and measured for each input and product
The challenge
In an operation that receives and ships bulk materials by road and rail, the planned volume only materializes if the whole chain keeps up: gates, scales, yards, tipplers, and the exit track.
- Many constraint points on the same route. Access controls, scales, storage yards, and tipplers share the same flow of trucks and trains.
- Desired volume is not possible volume. Without modeling the whole system, the plan may ask for more than a material can handle, or less than the operation is able to move.
- Interlinked fleet and equipment. How many trucks and locomotives to call, and at what time, depends on tippler availability and single-track occupancy.
The solution
With Enacom, the operation began representing its logistics as a single system, on three fronts:
Receiving
determines the effective capacity for receiving and unloading raw materials, with the demand for trucks and locomotives, the bottlenecks at the tipplers, the average cycle time per material, and the occupancy rate of the single track.
Internal handling
calculates the maximum quantity of products processed and the number of locomotives and wagons required, and simulates alternative flows between production areas and yards.
Dispatch
models shipping by road and rail, with vehicle demand, cycle time, and track occupancy, and sets the arrival time of trucks at the mine.
Operating context
Results
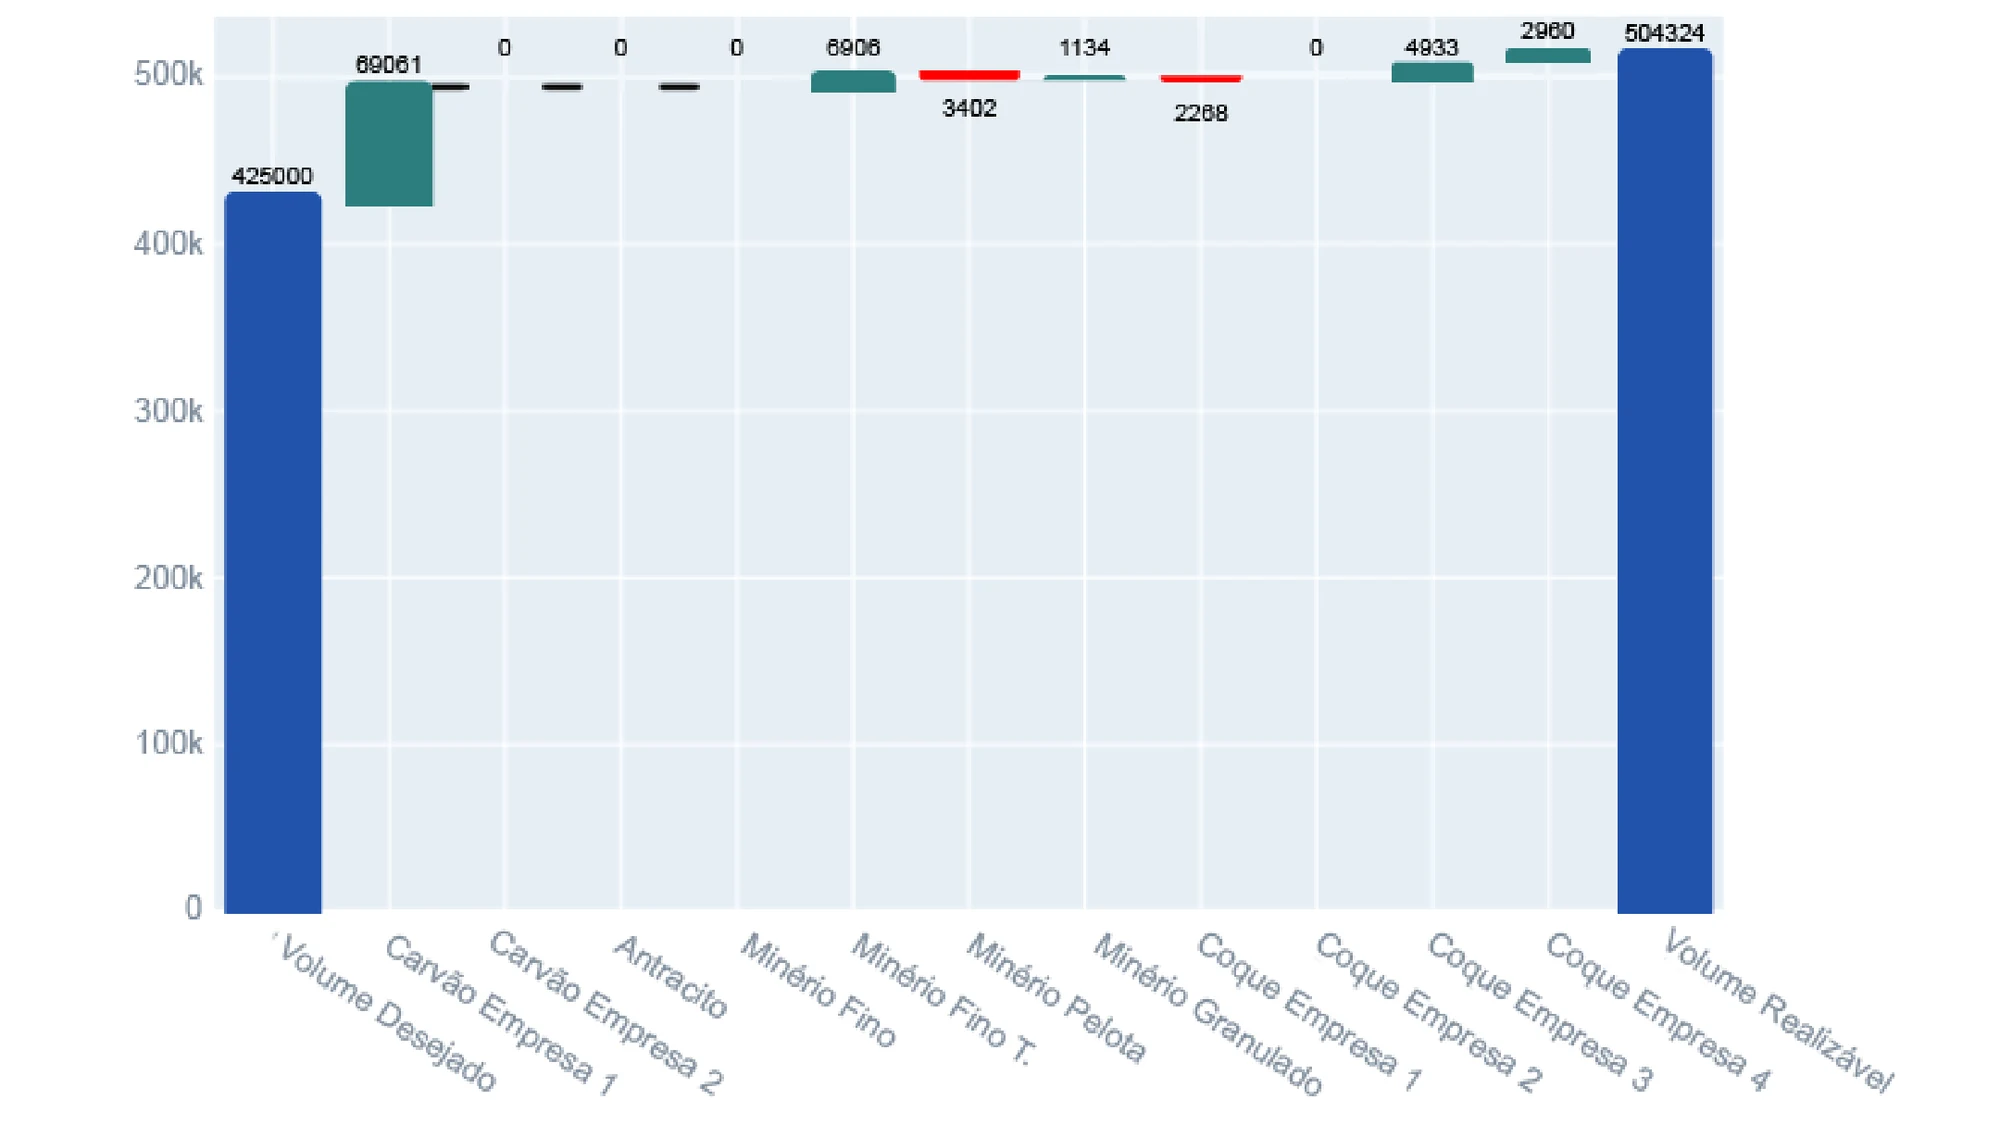
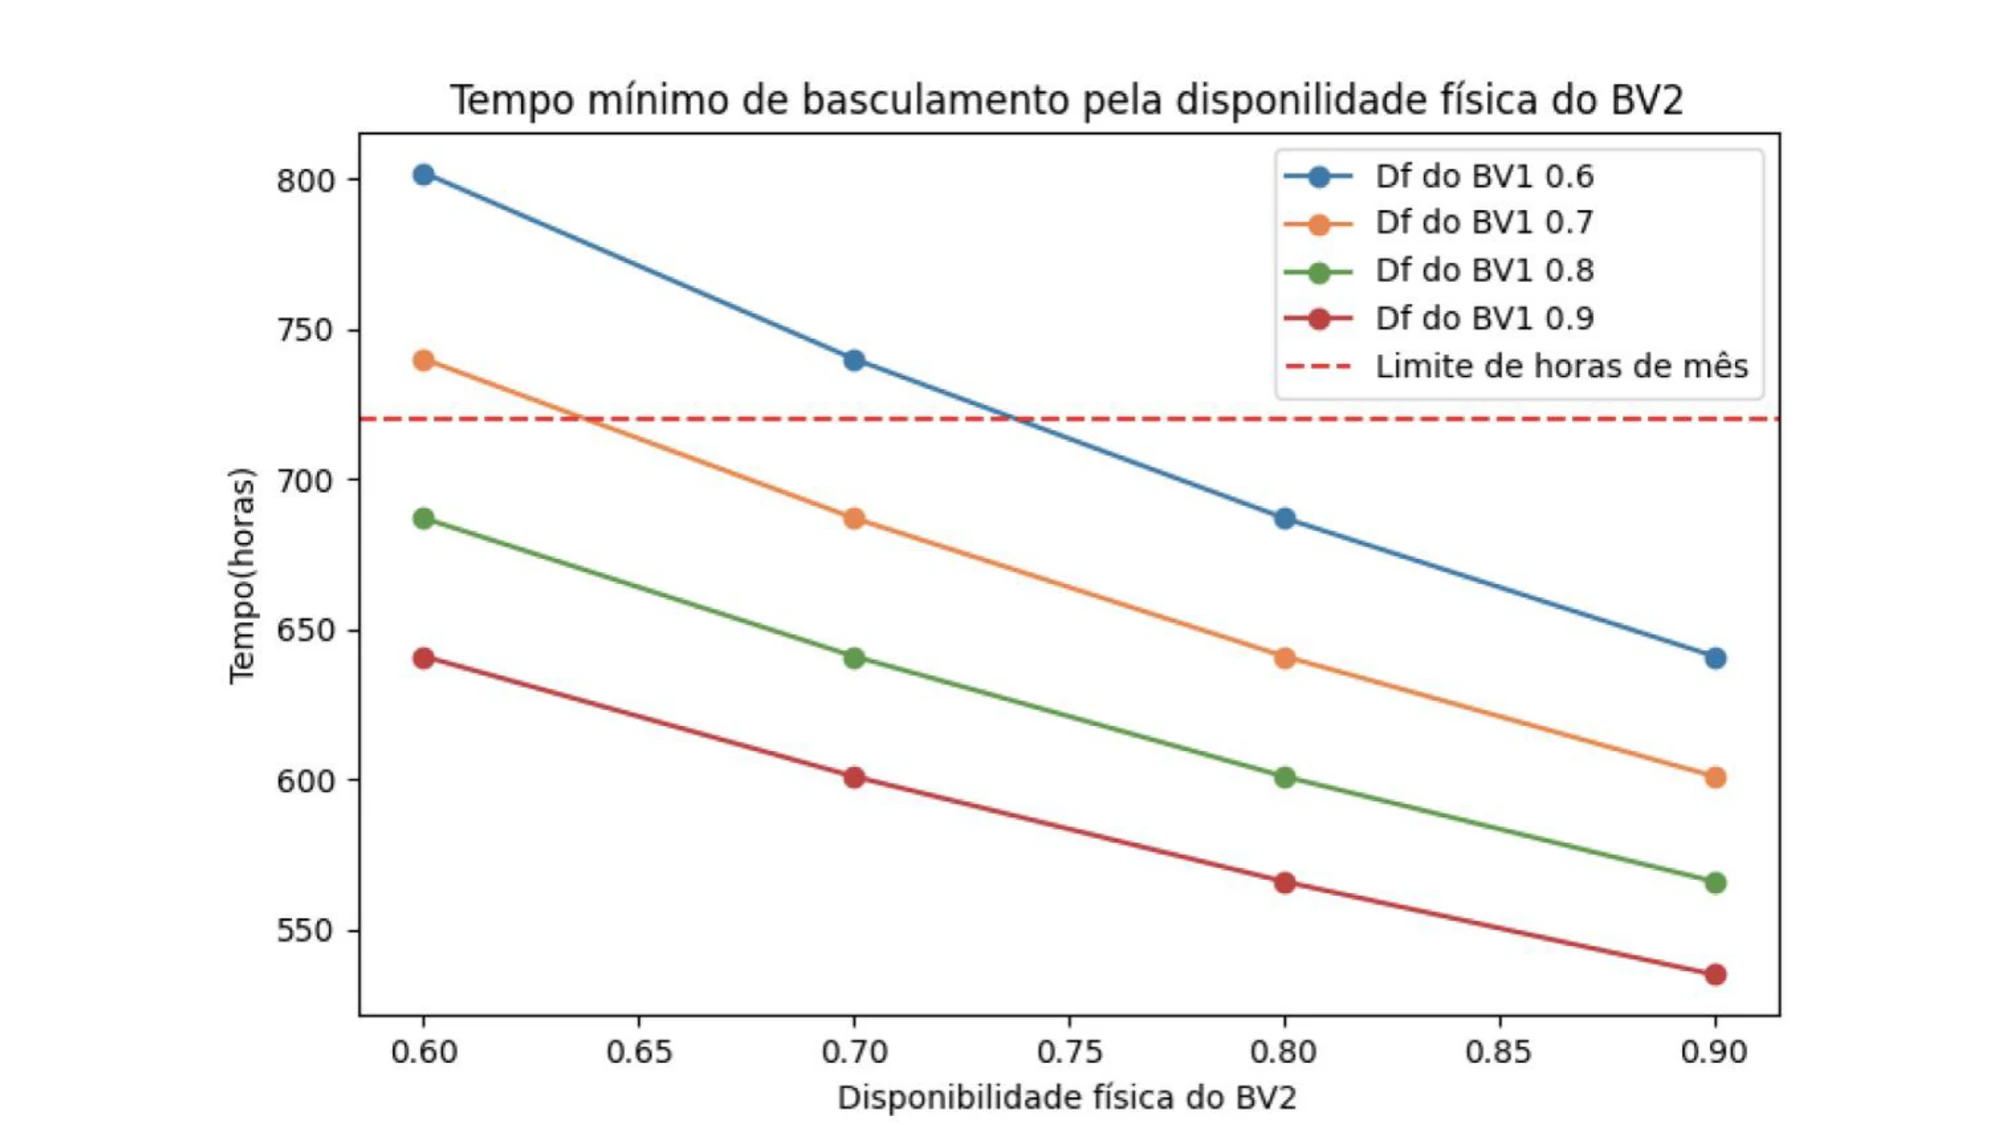
The optimizer compares the desired volume of each material with the volume the operation can achieve and shows, by material, where the plan can grow and where it needs to be reduced. In the same analysis, it indicates the combinations of tippler availability that fit within the hours of the month without bottlenecking the system, and the flows able to carry the greatest volume.
This case describes the analyses the optimizer offers to logistics planning. Operational gains measured after adoption are not part of this publication.
What changes for management
- A feasible plan before it becomes a commitment. The month’s volume is checked against the real capacity for receiving, yard, and dispatch.
- A bottleneck with a name and a size. The limit appears by material and by equipment, such as tipplers and single track, with the volume involved.
- Fleet sized by need. The number of trucks and locomotives and the arrival time at the mine come from the system’s capacity.
- Maintenance and logistics in the same conversation. The minimum tippler availability needed to meet the plan is explicit.
This case is for you if
- Your operation receives or ships bulk materials by road and rail, with shared yards, scales, and tipplers.
- The month’s plan runs into limits that only show up in execution.
- You need to define fleet, arrival times, and equipment availability from the real capacity of the system.
We start from your flows: we map receiving, internal handling, and dispatch and measure where the bottleneck is before any investment in fleet or equipment. The results of this case reflect the conditions of the operation analyzed.
Want to know how much your logistics can actually move?
Notes on the results
- Horizon: planning from D+1 (next day) to M+1 (next month), by road and rail.
- Achievable volume: volume the operation can move considering the modeled constraints on receiving, yard, equipment, and dispatch.
- This case describes the optimizer’s analysis capabilities; it does not present measured operational gains.
- The charts of desired and achievable volume and of minimum tipping time are illustrative.
Enacom project for a bulk-materials operation. Client name kept confidential.