Performance by flow
See where each flow produces, waits, or stops, instead of looking only at the plant average.
 Talk to an expert
Solution by decision
Global indicators hide where results are lost. The Performance Digital Twin shows performance by flow, by SKU, and by lead time, and anticipates bottlenecks before they become delays.
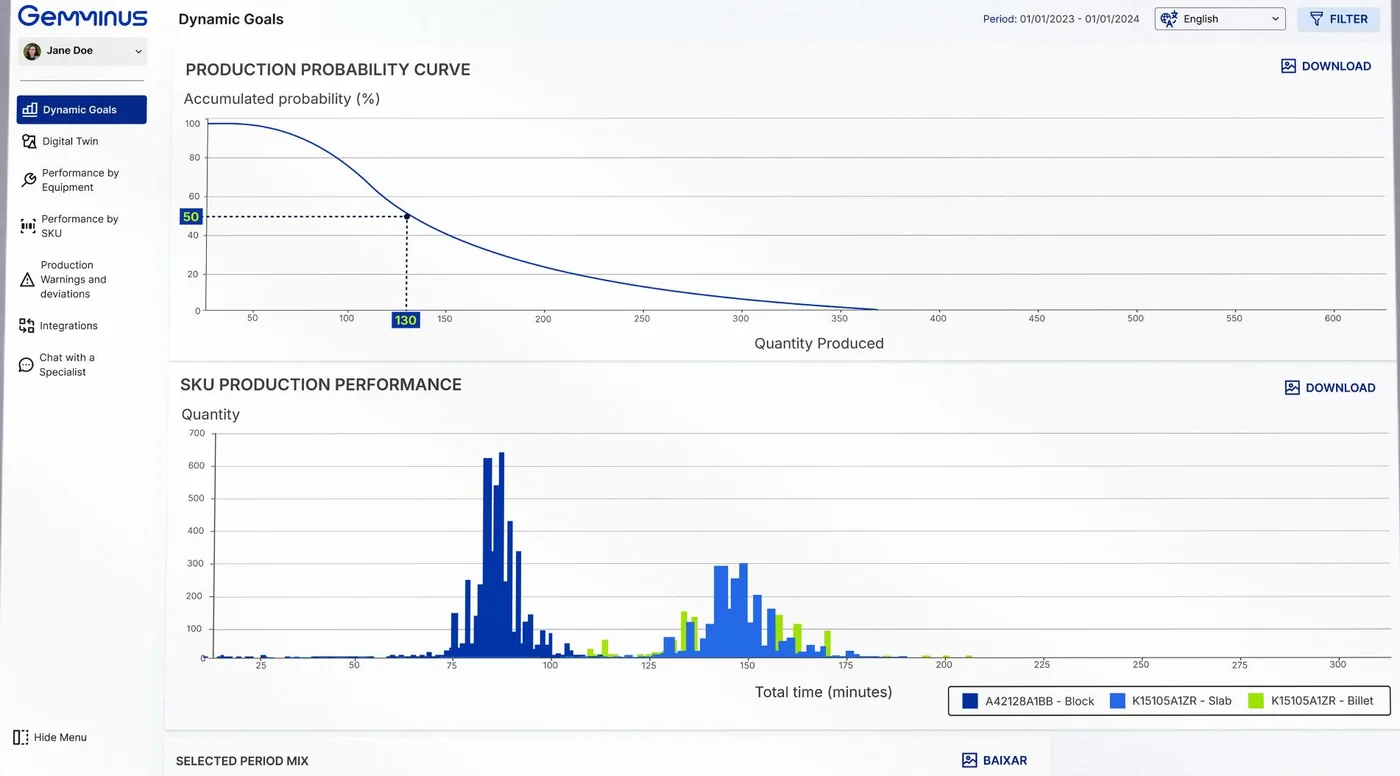
See where each flow produces, waits, or stops, instead of looking only at the plant average.
Understand how the product mix affects capacity and results.
Identify ahead of time what will limit delivery.
Compare the plan with execution and learn where the plan needs to change.
The Gemminus platform Digital Twins that support this topic.
Results measured in real operations, tied to this decision.
VLI: 5% more planning accuracy in logistics, with scenarios in about 2 minutes
View caseFewer stand changes and production in line with the plan in two section rolling mills
View caseOEE summarizes a piece of equipment's efficiency, but it does not show how flow and product mix affect lead time and results. The Performance Twin joins both views.
Production, downtime, and order data, usually already available in systems such as MES and ERP. In the technical assessment we define what is essential.
Yes. It is common to start with one flow or line and expand later, as results appear.
See other topics where Enacom supports the operation.
Increase productivityReduce costsImprove operationsUnderstand cost and marginRisk and capacity
Tell us what limits results today. Our team will assess with you where a Digital Twin can deliver value first.