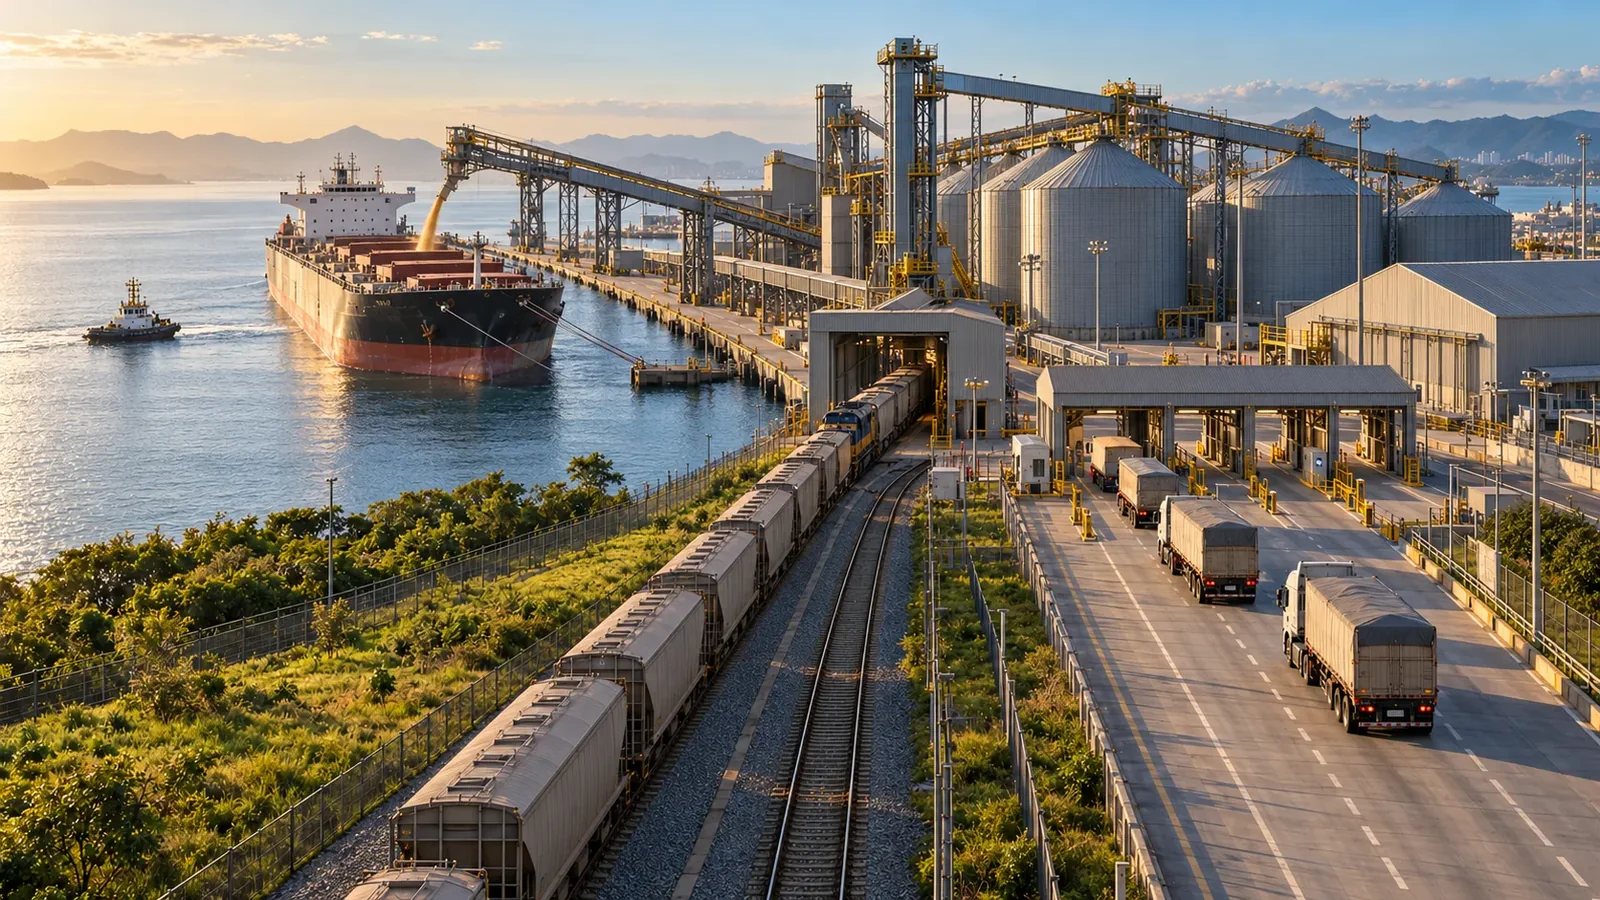
A single plan for links that plan alone today
Ports, terminals, and corridors enter the same model. In the VLI case, 5 ports, 8 terminals, and 5 corridors were planned together, with 5% more accuracy in logistics planning.
 Talk to an expert
Connect transportation, inventory, and capacity in an integrated analysis. Compare scenarios to improve service and resource utilization.
Discuss your logistics planningIn bulk and industrial cargo logistics, results depend on links that are rarely planned together: the mine or plant, the terminal, the rail corridor, the port, and the vessel. Each link has its own capacity, calendar, and constraints, and a plan that ignores one of them creates queues, demurrage, idle stock, and idle assets.
Enacom connects those links in a single analysis. Digital S&OP brings the Ports, Rail, and Multimodal modules into one sales and operations planning platform, simulates complete scenarios in minutes, and shows where the capacity conflict is before execution. We start from existing interfaces and systems and define the indicators with the client’s team.
The VLI case shows the format: ports, terminals, and rail corridors came to be planned in a single model, with scenarios simulated in about two minutes.
The plant or mine, terminal, railway, and port are usually planned separately. When one link slips, the damage shows up as vessel queues, idle trains, and excess stock. The solution brings the links into a single plan and shows the conflict before execution.
Ports, terminals, and corridors enter the same model. In the VLI case, 5 ports, 8 terminals, and 5 corridors were planned together, with 5% more accuracy in logistics planning.
A complete scenario is simulated in about 2 minutes. The team compares alternatives during S&OP, while there is still time to change course.
By anticipating capacity conflicts, the plan reduces waiting and makes better use of vessels, trains, and terminals, with the same assets.
The analysis shows which assumption weighs most on the result (in the studies, transit time), so the company tracks what matters and revises the plan in time.
Financial return. The value in reais depends on each operation’s volume and margin. We calculate the return and payback period with your company’s data, before scaling the project.
Logistics S&OP ties volume demand to real conditions of transportation, storage, and dispatch. The decision is how much to commit to the customer and how to distribute that volume across the links.
Volumes are tied to the capacity of each link, and the resulting plan is compatible with what ports, railways, and terminals can actually process. In the VLI case, 5 ports, 8 terminals, and 5 corridors enter a single plan, with more than 20 products.
Each complete scenario is simulated in about two minutes, which lets teams compare transportation, storage, and dispatch alternatives during the S&OP meeting, not weeks later.
In a study of a rail and port operation, ten assumptions were varied by ±5%, ±10%, and ±15% (60 simulations). Transit times concentrated the greatest sensitivity, and loading rate, port handling, and interchange rate had close to zero effect. The practical recommendation is to monitor transit, review the plan when deviation passes 10%, and report planned volume with a deviation range, not a single number.
Indicators are defined with the client’s team and measured on the same simulation: vessel and train waiting time, asset use, and inventory levels, so the S&OP conversation deals with the same number.
Reference. The Digital S&OP at VLI case details the challenge, the solution, and the results. See the VLI case
At the port, the decision is in what order to serve vessels, at which berth, and with what stock available, without paying demurrage or leaving the berth idle.
Simulation of vessel queues and berth occupancy shows the effect of each berthing sequence on waiting and berth use, with the terminal’s operating constraints.
Tides and rain enter the model as conditions that change loading capacity, not as surprises handled after the plan is already published.
The volume available in the terminal yard is connected to what arrives by each mode and to what the vessel needs, so shipment does not depend on a replenishment the plan ignored.
On the railway, the decision is how to run trains to use the corridor well, respecting crossings, yards, and the interfaces with terminals and ports.
The Rail module simulates train circulation and corridor use, with waiting and asset-use indicators defined with the client’s team.
Loading, interchange, and port handling rates sit in the same model, and sensitivity analysis points out which of those assumptions really change the result.
Because transit dominates the plan’s sensitivity, monitoring transit time deviation becomes an objective trigger for replanning.
The multimodal decision is to combine road, rail, and port with the stock at each point, at the lowest cost that still meets the service level.
The Multimodal module ties flows to inventory so that the transportation decision accounts for what is already stored at each point of the network, not just the freight table.
At a steel company, the network analysis, from plants and ports to wholesale units, considered 500 possible locations and identified 304 improvement opportunities, of which 44% (133) can be solved with software. The analysis supported the definition of the Distribution Centers.
A method combines clustering of operating periods, explanation of result drivers with Random Forest and SHAP, and scenario estimation with prediction intervals. The planner understands portfolio behavior and estimates scenarios with stated uncertainty.
A natural-language assistant answers from the digital twin’s and Digital S&OP’s data, giving decision support without requiring the planner to navigate dashboards.
Reference. The logistics network and Distribution Centers case shows the full analysis. See the network case
How each approach handles the criteria that define the quality of planning for ports, railways, and multimodal operations.
| Operating criterion | Spreadsheets and plans per link | Generic planning module | Enacom Digital S&OP (Gemminus Platform) |
|---|---|---|---|
| View of the links (origin, terminal, railway, and port) | Each link plans alone, in its own spreadsheets | Usually covers one mode or one system at a time | Ports, terminals, and corridors in a single model; in the VLI case, 5 ports, 8 terminals, and 5 corridors |
| Time to simulate a scenario | Days to consolidate the data and rebuild the plan | Hours, and depends on configuration | About 2 minutes for a complete scenario |
| Capacity conflict | Shows up in execution, as vessel queues or idle trains | Detected by fixed rules in each module | Shown before execution, link by link |
| Uncertainty in assumptions | A single value, with no deviation range | Fixed parameters and limited sensitivity | Sensitivity analysis (OAT) points to the assumption that weighs most, such as transit time |
| Technology integration | Isolated from TMS, WMS, and ERP | Often requires replacing systems and a long rollout | Starts from the interfaces and systems already in place |
| Return focus | Keeping the routine | IT standardization | Less waiting and better use of vessels, trains, and terminals, with the same assets |
Logistics applications run on the Gemminus platform and start from the interfaces and systems the client already has, such as TMS, WMS, and ERP. The platform consolidates the data of each link, runs the simulation, and returns plans, indicators, and alerts.
The approach is the same as in the other industries: start from the decision that most limits results, validate in known scenarios and a pilot, and only then widen the scope to other links.
A logistics project starts by understanding where the flow loses time and by connecting the links that are planned separately today.
We survey ports, terminals, corridors, and inventory, the interfaces and existing systems, such as TMS, WMS, and ERP, and define with the team the indicators of waiting, asset use, and stock.
We replay an operating period and compare the simulated result with what happened, so the planner trusts the capacity assumptions of each link.
The team starts comparing complete scenarios in the S&OP meeting, with explicit assumptions and sensitivity analysis on transit times.
With the first flow stable, we include new terminals, corridors, and products in the same plan.
It is a sales and operations planning platform with three modules, Ports, Rail, and Multimodal, that simulates complete logistics scenarios and shows capacity conflicts before execution.
Vessel queues and berth occupancy, train circulation and corridor use, road, rail, and port flows tied to inventory, and distribution network design.
In the VLI case, about two minutes for a complete scenario of ports, terminals, and corridors.
No. We start from existing interfaces and systems and add the planning and simulation layer.
With sensitivity analysis of assumptions, monitoring of deviation, and plan review when it exceeds a defined limit, instead of a single planned value with no deviation range.
Real logistics planning projects, with the results and the conditions under which they were obtained.
VLI: 5% more planning accuracy in logistics, with scenarios in about 2 minutes
View caseEach front pairs the case where the optimization ran in operation with the papers in which Enacom's team publishes the methods behind that front at technical conferences and in scientific journals. Practical proof and scientific proof, side by side.
Case in operation
Tell us what is holding your operation back. Together, we can assess the challenge and where Enacom could help.