
Mining company simulates loading and hauling to prioritize investments and points to up to 4% productivity gain
With Enacom, the mining company began simulating the loading, hauling, and crushing cycle of an open-pit mine and comparing fleet and equipment scenarios before investing, building the investment portfolio within the available budget.
Talk to an Enacom expertKey results
- Up to 4%
- productivity gain in the simulated scenarios
- < 5%
- model error compared with other methodologies
- Up to 3x
- faster than other simulation methodologies
The challenge
In an open-pit mine, drilling, loading, and hauling can account for up to 50% of operating costs. Deciding where to invest, in trucks, loaders, or crushing, requires knowing how each choice changes the whole cycle:
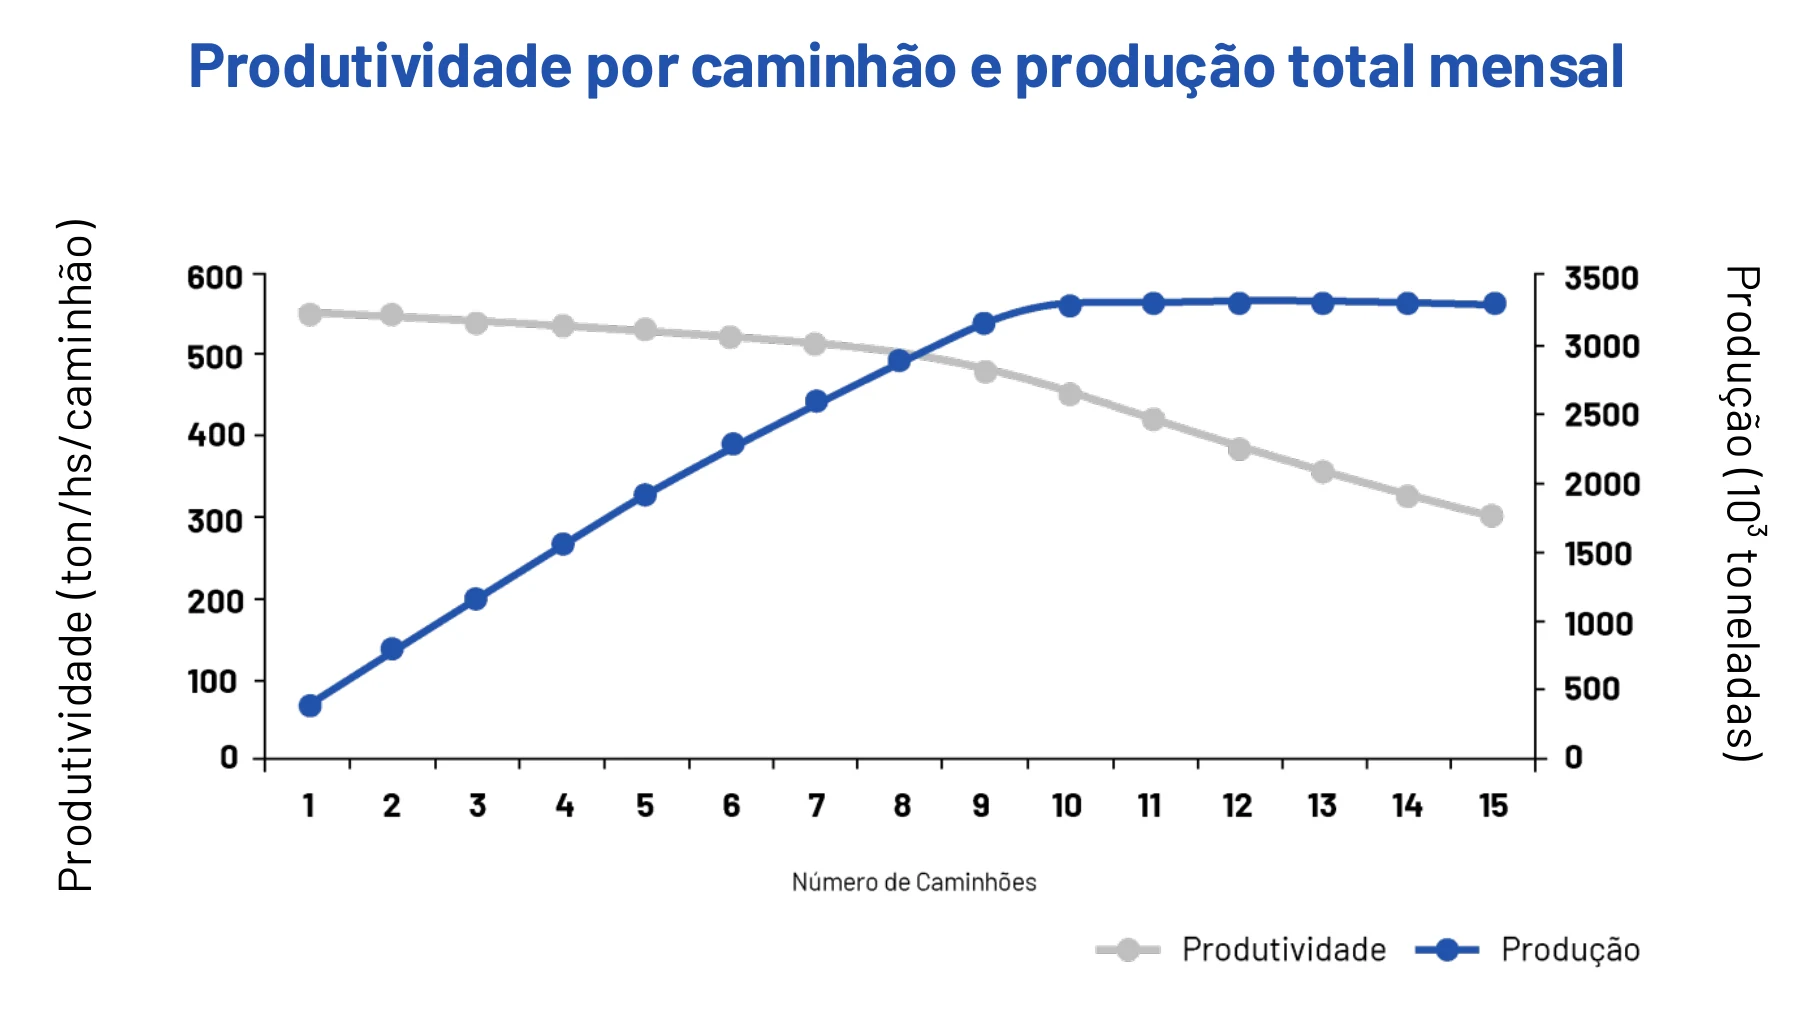
- More trucks do not always mean more output. Beyond a certain point, the extra fleet forms queues at the loader and the crusher, and the productivity of each truck drops.
- Real operating variability. Each truck’s load varies from trip to trip, and a calculation with average values does not capture that effect.
- Limited budget. With scarce resources, each investment has to be compared with the others by its effect on output.
The solution
With Enacom, the mining company began evaluating investments on a model of its own operation, in three steps:
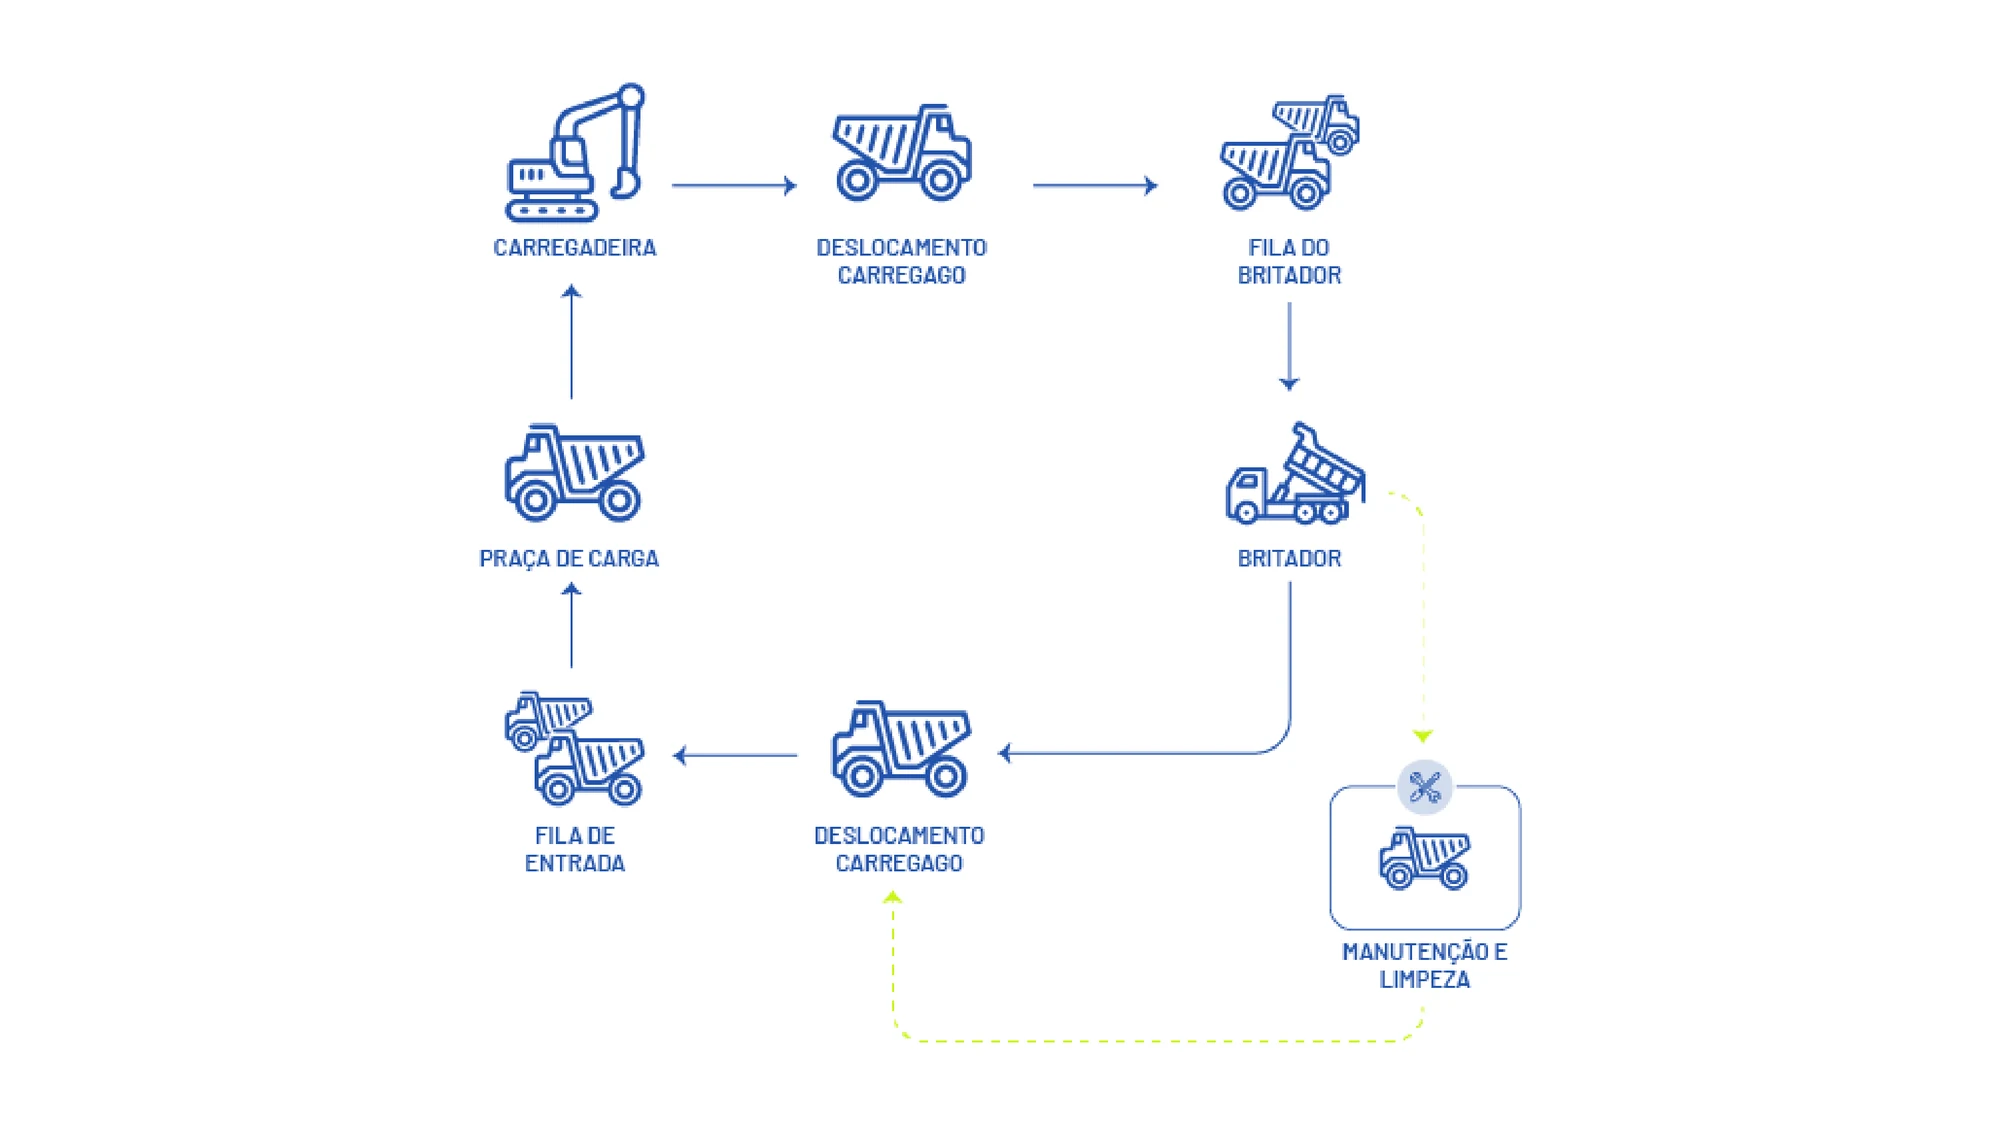
Represents the mine cycle
from the loading area to the loader, the loaded haul, the queue and the crusher, and back to the entry queue, with detours for maintenance and cleaning. The model uses Petri nets, a technique for modeling discrete-event systems.
Simulates the operation with real variability
including the distribution of the loads recorded on CAT-793C and CAT-793D trucks and scenarios with multiple trucks, queues, and parallel processes.
Prioritizes the investments
comparing scenarios and building the portfolio that delivers the most result within the budget limit.
Operating context
Results
In the simulated scenarios, optimizing loading, hauling, and dumping times reduced queues and equipment idle time and raised monthly output, with productivity gains of up to 4%. The simulation also showed the point at which adding trucks stops increasing output: beyond it, the extra fleet creates queues and lowers each truck’s productivity.
The model showed an error below 5% and was up to 3 times faster than other methodologies, which makes it possible to assess more scenarios in short- and long-term planning.
What changes for management
- Investment compared by its effect on output. Trucks, loaders, and crushing compete for the same budget based on the simulated result of each alternative.
- Fleet size with a basis. The fleet saturation point is visible before the purchase.
- Planning with real variability. Decisions consider load variation and queue formation, not just averages.
- More scenarios in the same time. Fast simulations make it possible to test more alternatives in the short and long term.
This case is for you if
- Your open-pit mine runs a fleet of trucks, loaders, and shared crushing.
- You need to decide where to invest with a limited budget.
- You want to know from how many trucks onward the additional fleet only creates queues.
We start from your operation: we represent the loading and hauling cycle, calibrate the model with your data, and compare investment scenarios before the decision. The results of this case reflect the conditions of the operation analyzed.
Want to know which investment brings the most output to your mine?
Notes on the results
- Productivity: gain of up to 4% obtained in the simulation of the scenarios evaluated; maximum value among the scenarios.
- Accuracy and speed: error below 5% and processing time up to 3 times shorter, compared with other simulation methodologies.
- Drilling, loading, and hauling costs: share of up to 50% of the operating costs of an open-pit mine, as an industry reference.
- The chart of productivity per truck and monthly output shows a simulation result.
Results of an Enacom project with a mining company. Client name kept confidential.