
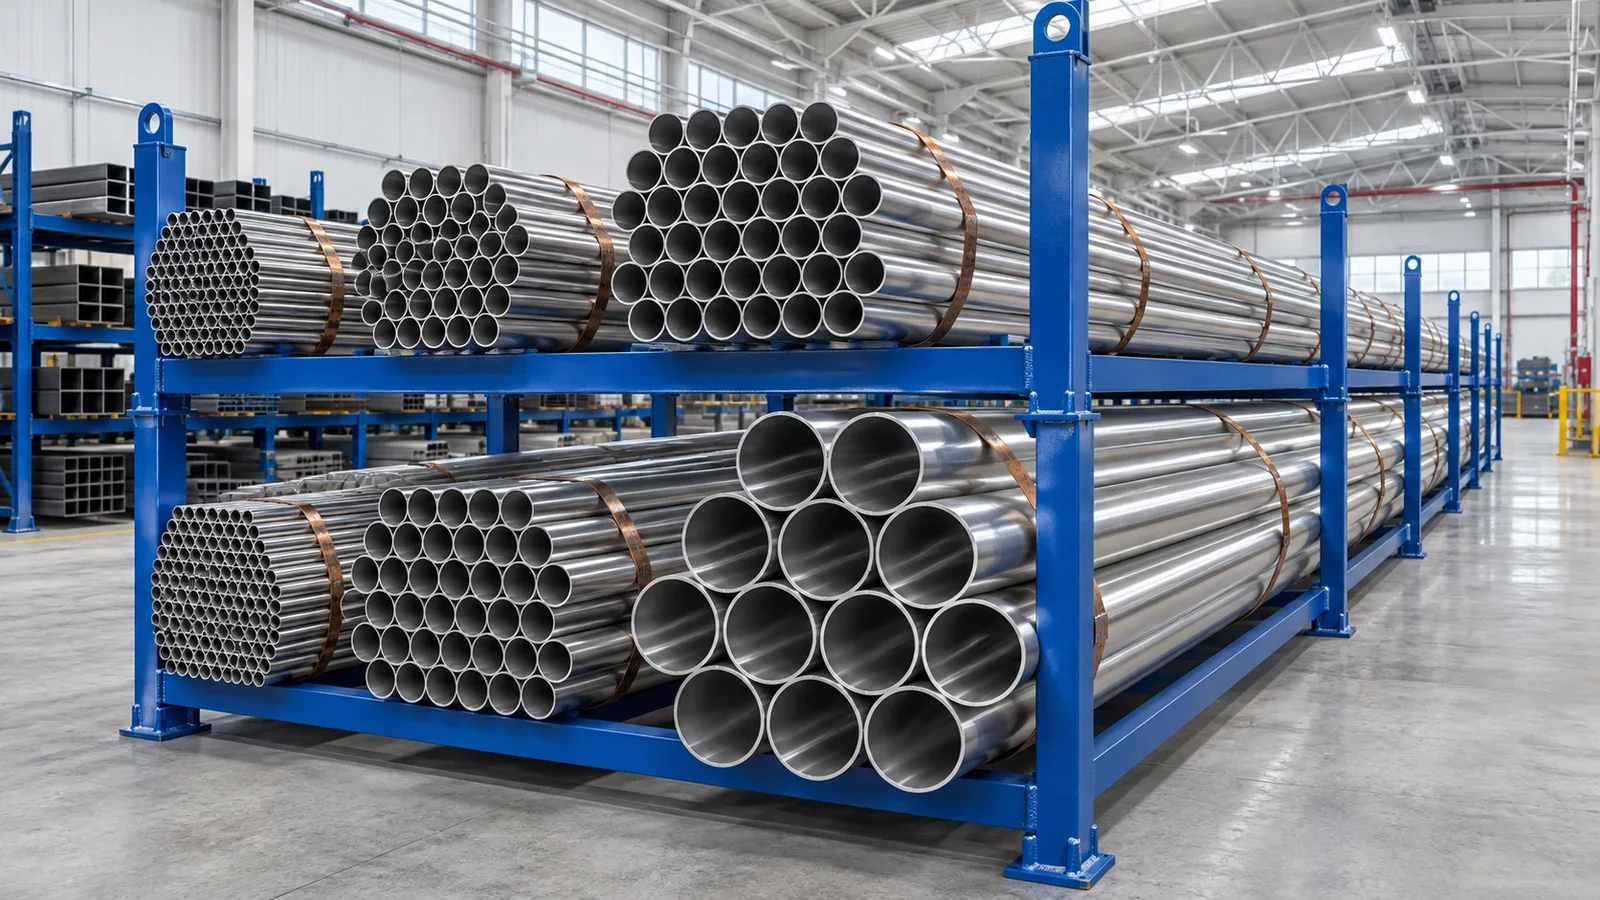
Steelmaker identifies 304 supply chain improvement opportunities by optimizing its distribution network
With Enacom, the company analyzed its logistics chain from the data, from plants and ports to wholesale units, to improve customer service at optimized costs and support the definition of its Distribution Centers.
Talk to an Enacom expertKey results
- 304
- improvement opportunities identified in the supply chain
- 44%
- of those opportunities (133) can be solved with software
- 500
- possible locations considered in the network analysis
- 6 + 2 + ~20
- ports, plants, and wholesale units in the same model
The challenge
The steelmaker needed to improve customer service while optimizing supply chain costs. The answer depended on an entire network, where every choice affects the others:
- Many links in the same chain. Two plants, six ports, and about 20 wholesale units share the same product flow to the customer.
- Where to set up distribution. Defining the Distribution Centers meant comparing hundreds of possible locations.
- Gains that are hard to see. Before deciding, it was necessary to know, from the data, where the gaps in the operation were and which gains were real.
The solution
With Enacom, the steelmaker began to look at the supply chain as a single system, from the plants to the customer, on three fronts:
Diagnoses the operation from the data
identifying the gaps in the supply chain operation and the improvement opportunities the data supports.
Optimizes the logistics network
considering in the same model 500 possible locations, 6 ports, 2 plants, and about 20 wholesale units to support the definition of the Distribution Centers.
Prioritizes what to do
separating, among the 304 opportunities identified, the 133 that can be solved with software.
Results
The analysis identified 304 supply chain improvement opportunities, supported by the operation’s own data. Of these, 133, or 44%, can be solved with software, which gives the company a clear starting point for prioritizing.
The numbers describe opportunities mapped in the diagnosis, not gains already realized. With the gaps and the network alternatives on the same basis, the company now has the elements to decide the location of the Distribution Centers and the sequence of improvements.
What changes for management
- Network decisions that compare alternatives. The location of the Distribution Centers is assessed against hundreds of options, with plants, ports, and wholesale in the same equation.
- Opportunities based on data. Improvements start from what the operation records, not from the isolated perceptions of each area.
- Clearer priorities. Knowing which opportunities depend on software helps separate what requires a system from what requires a process change.
- Service and cost in the same analysis. Customer service level and logistics cost are assessed together, not in separate projects.
This case is for you if
- Your distribution combines several plants, ports, and points of sale or wholesale.
- You are evaluating opening, moving, or consolidating Distribution Centers.
- You want to know, based on data, where the gaps in your chain are before investing.
We start from your data: we map the chain, identify the opportunities, and compare network alternatives before any decision. The results of this case reflect the conditions of the operation analyzed.
Want to know which opportunities your supply chain is hiding?
Notes on the results
- Opportunities: improvements identified in the supply chain diagnosis; they do not represent gains already realized.
- Addressable by software: 133 of 304 opportunities (43.75%, rounded to 44%).
- Scope of the analysis: 500 possible locations, 6 ports, 2 plants, and about 20 wholesale units.
Results of Enacom’s project with a steelmaker, as recorded in the project.